

Quick answer:
Landing page conversion rate optimization is the process of improving a single, focused page so a higher share of visitors complete one specific action. The basic steps are to calculate your current conversion rate, find where visitors drop off, fix the biggest problems first, and test changes one at a time.
You pay for clicks, write the ad, and send people to a landing page. Then most of them leave without doing anything. It’s a common problem, and it’s often fixable.
Landing page conversion rate optimization (CRO) is the work of improving one page so that more of its visitors take the action you want, such as buying, booking a call or filling in a form. This guide gives you a simple process to follow: measure your starting point, find the problem, fix the biggest issues first, and test your changes properly.
What Is Landing Page Conversion Rate Optimization?
Landing page conversion rate optimization is the process of improving a standalone page so that more visitors complete one specific action. That action is called a conversion. It could be a purchase, a sign-up, a demo request or a download.
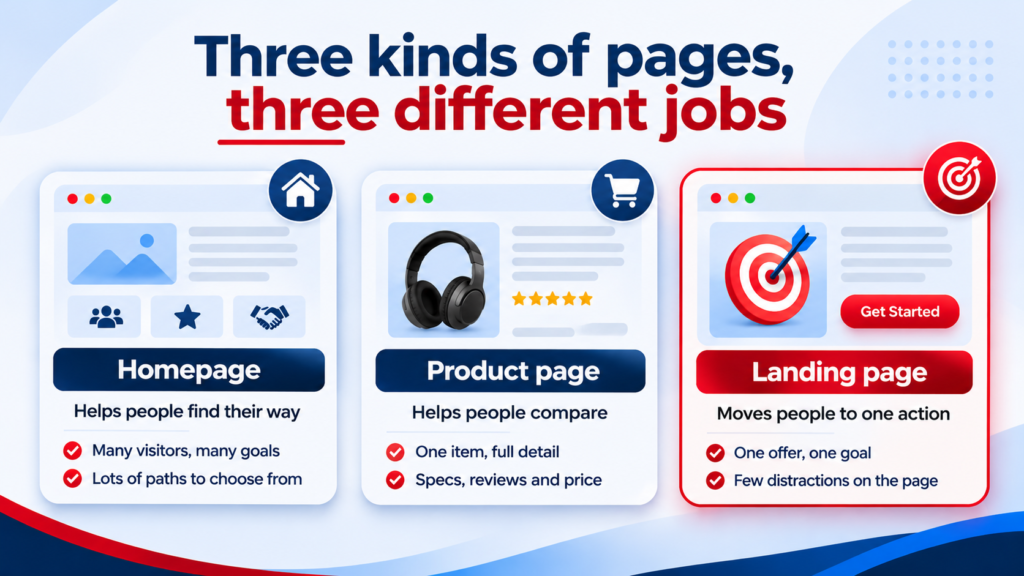
A landing page is not the same as a homepage or a product page. A homepage helps people find their way around your site. A product page helps people compare details. A landing page has one job: to move a visitor toward a single action. That’s why optimizing it mostly means removing anything that gets in the way.
Why it’s worth the effort
- You get more from the traffic you already have. If you improve conversions, you don’t need more visitors to get more leads or sales.
- Paid traffic gets cheaper per result. If you run ads, a higher conversion rate lowers your cost per lead or sale. Google Ads also looks at landing page experience as part of its ad quality score, so a better page can help your campaigns too.
- You learn what your audience cares about. Each fix or test tells you something about your customers.
You’ll see the terms “landing page optimization” and “landing page CRO” used for the same thing. General CRO is wider. It covers the whole website, including product pages and checkout.
How to Calculate Your Landing Page Conversion Rate
The formula is simple:
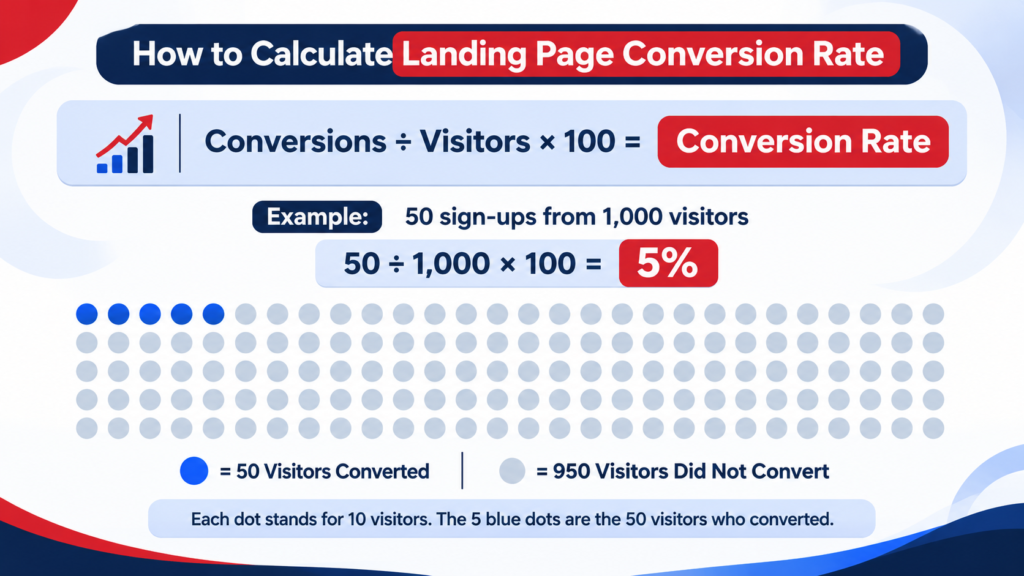
Conversion rate = (conversions ÷ visitors) × 100
For example, if 1,000 people visit your page and 50 of them sign up, your conversion rate is 5%.
A few things keep your numbers honest:
- Pick one main conversion per page. Track the completed action, such as a submitted form or a finished purchase, not just a button click.
- Be consistent with visitors. Some tools count sessions and others count unique users. Choose one and stick with it, or your results won’t be comparable over time.
- Look at traffic sources separately. Email visitors, paid search visitors and social visitors often behave very differently. One blended number can hide the real story.
- Use enough time. A few days of data can be misleading. Aim for a period that includes a normal mix of weekdays and weekends.
If you’d rather skip the math, use our free landing page conversion rate calculator. It also shows revenue per visitor, profit and ROI.
What Is a Good Landing Page Conversion Rate?
It depends on your industry, your traffic source and what you’re asking visitors to do.
One of the most cited datasets comes from Unbounce. It analyzed about 41,000 landing pages and 464 million visits, and found a median conversion rate of 6.6% across industries. For SaaS pages, the median was lower, at 3.8%. A median means half of the pages did better and half did worse.
You’ll see other numbers online, some lower and some higher. That’s because reports measure different things. Some include every page on a site, and others only include dedicated landing pages. So don’t treat any single figure as a promise.
A more useful comparison is your own page. Compare it to your past results, using the same traffic source and the same offer. Our calculator also gives a rough label to your result (below 2% is low, 2% to 5% is average, 5% to 10% is strong, and 10% or more is elite). Use those labels as a quick guide only.
Step 1: Find Out Where Visitors Are Dropping Off
Before you change the page, find out what’s actually going wrong. Three types of evidence help:
- Numbers. In Google Analytics 4, check conversion rate by device and traffic source. Look at how many people start your form compared with how many finish it.
- Behavior. Heatmaps and session recordings show where people click, scroll and stop. Microsoft Clarity is free, and Hotjar is another popular option. Watching 20 to 30 recordings often reveals problems that numbers can’t.
- Feedback. Ask recent customers why they chose you. Read your sales and support conversations. Add a one-question survey to your thank-you page.
Then run a few quick checks yourself:
- Open the page on your phone. Is it easy to read and use?
- Look at the top of the page for five seconds. Could a stranger tell what you offer and what to do next?
- Fill in your own form. Does it work? Does the thank-you page load? Is the conversion being tracked?
Broken forms and broken tracking are more common than most people expect, and fixing them costs very little.
Step 2: Fix the Page Elements That Affect Conversions Most
These are the areas that most often hold a landing page back. Start with the ones that match your findings from Step 1.
Headline and value proposition
Your headline should say what you offer and who it’s for, in plain words. Clever wording is less useful than a clear promise. Support it with a short line that explains the main benefit.
Message match
The page should match the ad, email or search result that brought the visitor there. If your ad promises a free quote and the page opens with a general company story, people get confused and leave. Use the same offer, wording and visuals from the click to the page.
One clear call to action
Choose one main action and make it obvious. Use button text that tells people what happens next, such as “Get my free audit” instead of “Submit”. Repeat the same call to action further down a long page, so people don’t have to scroll back up.
Forms: ask for less
Every extra field adds effort. Ask only for what you need to follow up. If you need more details later, collect them in a second step or on a call. Explain what happens after someone submits, such as “We’ll reply within one business day.”
Trust and social proof
People hesitate when they don’t know you. Reduce that doubt with real customer reviews, short case studies, recognizable client logos, guarantees, and clear contact details. Only use proof that is true and that you can back up.
Speed and mobile experience
Slow pages frustrate visitors, and many landing page visits come from phones. Test your page in Google’s PageSpeed Insights and review the Core Web Vitals results. Google’s “good” targets are a Largest Contentful Paint of 2.5 seconds or less, an Interaction to Next Paint of 200 milliseconds or less, and a Cumulative Layout Shift of 0.1 or less. Check mobile conversion separately from desktop, because the two can differ a lot.
Navigation and clutter
If your landing page has the full site menu, visitors can click away to many other pages. Many landing pages remove or reduce the navigation for this reason. If people need more information, add anchor links that scroll within the same page.
Simple, readable copy
Short sentences and everyday words are easier to act on. Break up text with headings and bullet points, and write as if you’re explaining the offer to a busy friend.
Step 3: Decide What to Fix First
You’ll probably end up with a long list of ideas. Don’t try to do all of them at once. Score each idea from 1 to 5 on three things:
- Impact: How much could this improve conversions?
- Confidence: How sure are you, based on evidence from Step 1?
- Ease: How quickly can you do it?
Add the scores together and start with the highest. Here is an example with made-up numbers:
| Idea | Impact | Confidence | Ease | Total |
|---|---|---|---|---|
| Match the headline to the ad wording | 4 | 4 | 5 | 13 |
| Cut the form from 8 fields to 4 | 4 | 3 | 4 | 11 |
| Add three real customer reviews | 3 | 3 | 4 | 10 |
| Redesign the whole page | 5 | 2 | 1 | 8 |
One rule applies before any scoring: fix broken things first. A form that doesn’t submit, a tracking error or a page that fails on mobile needs repair, not testing.
Step 4: Test Changes the Right Way
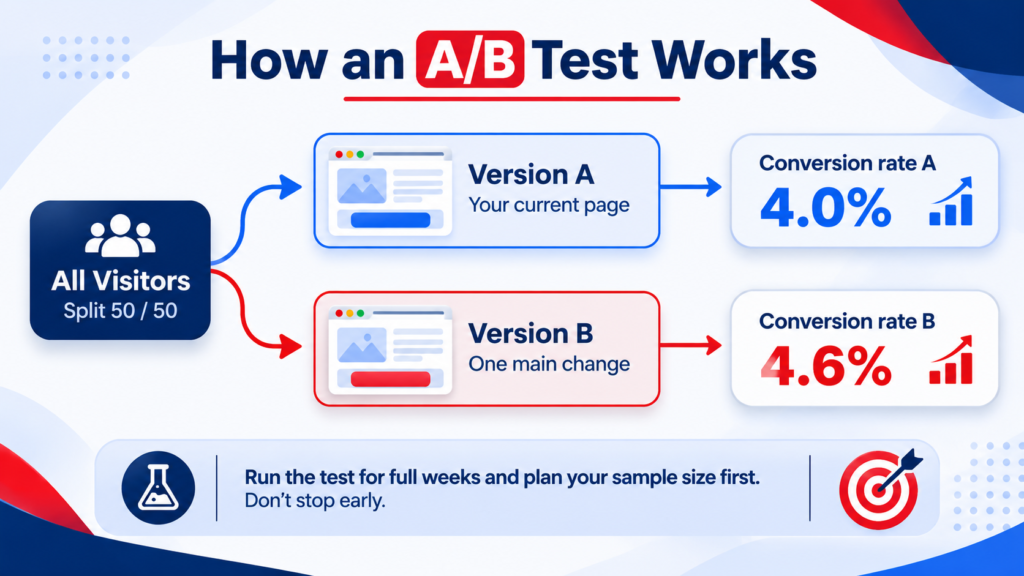
Once the basics are fixed, A/B testing helps you learn what really works. In an A/B test, half of your visitors see the current page (version A) and half see a changed version (version B).
A good test follows a few habits:
- Write a hypothesis. For example: “Because visitors drop off at the form, a shorter form should increase submissions.”
- Change one main thing. If you change the headline, image and button together, you won’t know which one made the difference.
- Decide your sample size before you start. A sample size calculator can help. As a rough guide, many testers want at least a few hundred conversions per version before trusting a result.
- Don’t stop early. Early results swing a lot. Run the test for full weeks so weekday and weekend behavior are both included.
- Write down the result, whether it wins, loses or ties. Losing tests teach you something too.
What if you don’t have enough traffic to test?
Many small sites don’t. If a test would take months to finish, it’s not a good use of your time. You can do this instead:
- Fix the obvious problems from Step 1 and Step 2.
- Make bigger changes, since small tweaks are hard to measure with little traffic.
- Rely more on recordings, surveys and customer feedback.
- Compare before and after periods, but be careful. Seasons, campaigns and traffic changes can distort the result.
Common Landing Page Optimization Mistakes
- Copying a competitor. Their audience, offer and traffic aren’t yours.
- Starting with button color. Offer clarity, message match and friction usually matter more.
- Changing many things at once and not recording what you changed.
- Ending tests after a couple of days.
- Chasing a benchmark instead of improving your own results.
- Looking only at conversion rate. A higher rate doesn’t help if the leads are poor. Also look at lead quality, revenue per visitor and cost per sale.
- Ignoring mobile visitors.
Landing Page CRO Checklist
Use this list as a quick review before you publish or update a page.
- One clear goal for the page
- Headline states the offer in plain words
- Page wording matches the ad or link that brought visitors
- One main call to action, repeated on long pages
- Form asks only for essential details
- Real social proof is visible without much scrolling
- Page loads quickly on mobile
- Mobile layout is easy to read and tap
- Navigation is limited or removed
- Conversion tracking tested and working
- Baseline conversion rate recorded before changes

Free Landing Page Conversion Rate Calculator: How to Use It
Knowing your landing page conversion rate is the first step in any optimization plan, and you shouldn’t need a spreadsheet to find it. Our free landing page conversion rate calculator turns your traffic and sales numbers into a conversion rate, revenue per visitor, profit and ROI. It also shows what a small improvement would be worth.
How to use it in 5 steps
- Enter your total visitors. Use the sessions or visitors that reached the page in your chosen period, and use the same measure each time.
- Enter your total conversions. This is whatever counts as success on the page: a sale, a sign-up or a lead.
- Enter your revenue per conversion. Use your average order value, sale price or estimated lifetime value.
- Add your traffic cost (optional). Enter a cost per visitor or your total ad spend. This unlocks the profit and ROI results.
- Set a target conversion rate (optional). The tool shows the lift you need and what reaching that rate is worth.
Your results appear instantly. Use the Copy Results button to save your baseline, and Reset to try another page.
Example: what a small lift is worth
These numbers are for illustration only. Replace them with your own.
| Current Page | Target | |
|---|---|---|
| Visitors | 2,000 | 2,000 |
| Conversions | 80 | 100 |
| Conversion Rate | 4% | 5% |
| Revenue per Conversion | $150 | $150 |
| Total Revenue | $12,000 | $15,000 |
| Traffic Cost | $1,200 | $1,200 |
| Profit | $10,800 | $13,800 |
With the same traffic and the same ad spend, moving from 4% to 5% adds 20 conversions and $3,000 in profit. That’s why even a modest improvement can be worth testing.
Final Thoughts
Landing page conversion rate optimization doesn’t need to be complicated. Start by measuring your baseline. Find the real problems, fix the biggest ones first, and test changes one at a time. Small, steady improvements add up, and each one teaches you more about what your visitors want.
If you’re ready to start, calculate your conversion rate today and write the number down.
Try the Before vs After scenario builder
The scenario builder lets you compare your current setup (Scenario A) with an improved one (Scenario B). You can change visitors, conversion rate, revenue per conversion or cost on their own, then compare revenue, profit, conversions and ROI. Use it to decide which fix is worth doing first. For example, you can compare a higher conversion rate against a lower cost per visitor.
Want a second opinion on your page? Request a free audit or contact our team, and we’ll help you find your biggest conversion leaks.
FAQs
What is a good landing page conversion rate?
There’s no single answer. Unbounce’s large dataset shows a median of 6.6% across industries, with SaaS lower at 3.8%. Your own past results, traffic source and offer give you a more useful comparison than a general average.
How do you calculate landing page conversion rate?
Divide the number of conversions by the number of visitors, then multiply by 100. If 50 of 1,000 visitors convert, the rate is 5%. You can also use our free calculator.
How long does landing page optimization take to work?
Fixing a broken form or a slow page can help right away. A proper A/B test usually needs a few weeks, depending on your traffic and conversion rate. Treat optimization as an ongoing habit, not a one-time project.
What’s the difference between landing page optimization and CRO?
Landing page optimization focuses on one campaign page. CRO is broader. It covers the whole website, including product pages, checkout and sign-up flows.
How much traffic do I need for an A/B test?
It depends on your current conversion rate and the size of the change you want to detect. Low conversion rates and small improvements need much more traffic. Use a sample size calculator before you start, and if the test would take months, improve the page using other evidence instead.
Should I send ad traffic to a landing page or my homepage?
In most cases, a dedicated landing page works better. It can match the ad’s message and guide people to one action. A homepage has to serve many visitors with many different goals.